

[10/7/2020] Premium Expert Consensus Rankings: More Arrows in Your Quiver
![[10/7/2020] Premium Expert Consensus Rankings: More Arrows in Your Quiver](https://storage.ghost.io/c/62/b1/62b175f1-13cb-4561-a261-7a91a0e63d58/content/images/size/w960/2020/10/ECR-2.0-Premium.png)
Hot on the heels of our Expert Consensus Rankings 2.0 update, we're excited to introduce Premium features for ECR.
Any FantasyPros Premium subscriber will have access to these new features, which include more detailed matchup ratings and historical player fantasy performance compared to projections.
These features are a part of our weekly rankings for all scoring types, with some other exciting new features that will be added in the coming weeks.
Matchup: Hot or Not?
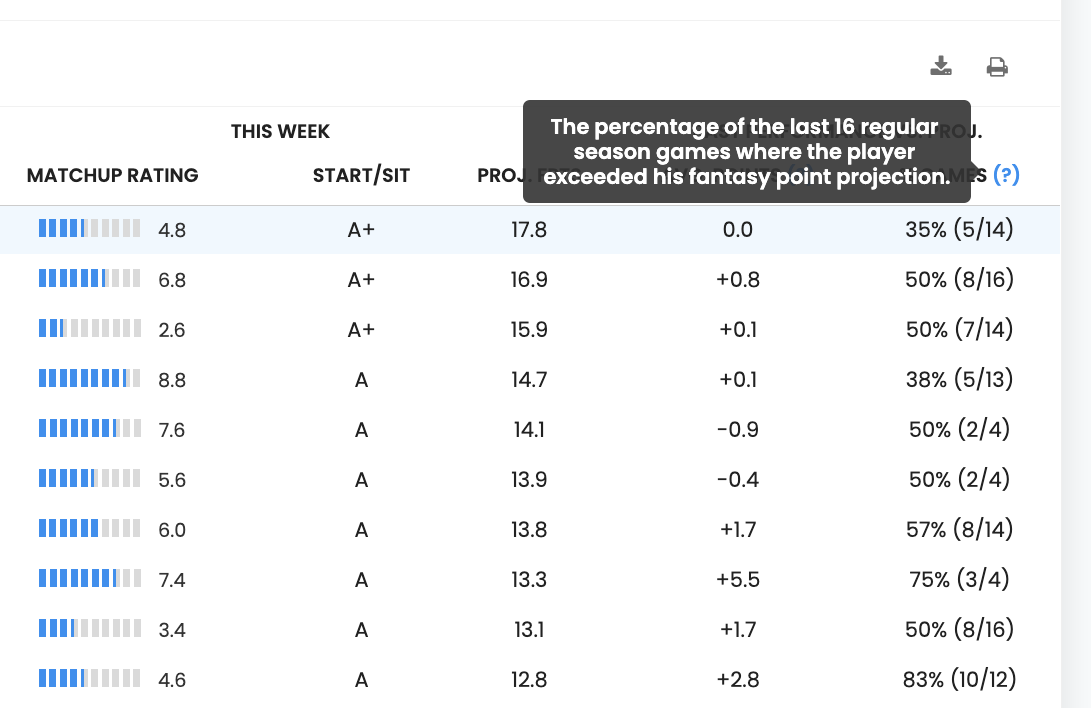
The first premium enhancement is an improved matchup rating. This rating is now on a scale of 0-10, with 10 being the most favorable for that player. The matchup is calculated using a variety of historical and projected factors.
You'll also get a fire icon next to players that have extremely hot matchups, meaning > 9.0.
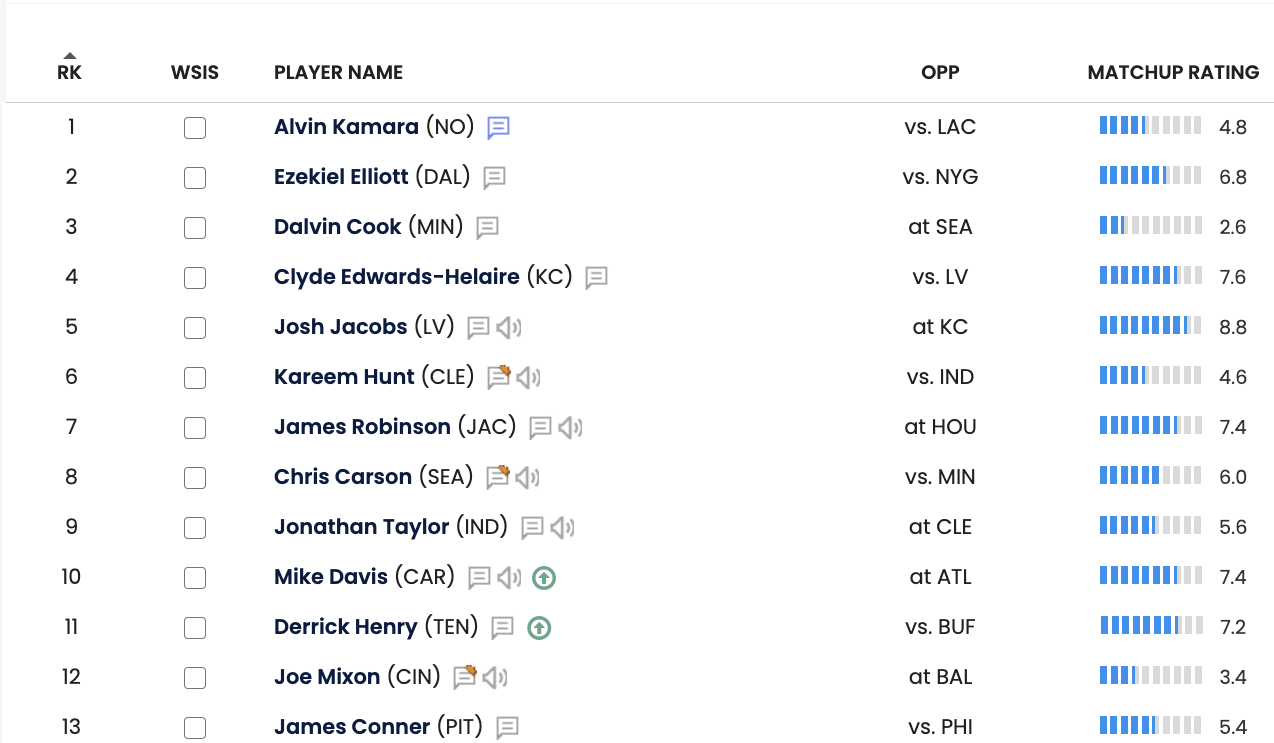
Start/Sit Grade
Next is the Start/Sit grade. This grade is essentially a distilled start/sit comparison for players with that positional category (i.e. QB, WR, RB, TE, and Flex). The grade is a letter grade scale, with A+ being the best.
Meets or Exceeds Expectations: Historical Performance
This a feature that users have been asking about for quite some time.
First, we have Average Points. This is the average number of fantasy points above or below the projections in the last 16 regular season games. Players with greater values here are more boom/bust; obviously, those with greater positive values here are the types of players that have a higher potential ceiling, are ones that can help you win a matchup.
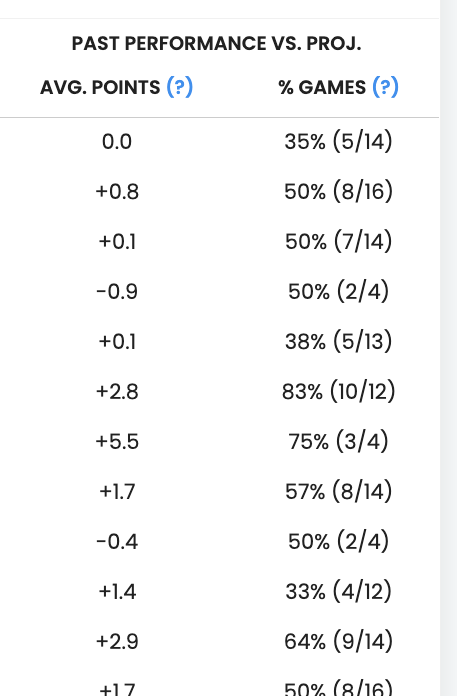
Next, we have % of games a player has exceeded their fantasy points projections. This is pretty much what it sounds like: how many games did this player exceed their projections? Are the projections a bit too rosy? Or does the player consistently exceed projections? When combined with the Average Points +/- you'll be able to tell how often and by how much.
Both of the values in the Past Performance vs. Projections columns are based on a rolling 16-game window. This means if a player was injured for 3 out of the last 16 games, we will calculate the data based on the 13 games the player did play.
Give the Premium ECR features a look and let us know what you think.
We'll be adding more Premium ECR features in the coming weeks, so keep checking back.
This is available to all Premium subscribers, so if you haven't subscribed take a look at our Premium plans.